Fabric Apps built on semantic models
Code-first apps that run in Microsoft Fabric and read their numbers from a Power BI semantic model. Each one has a public copy you can open without signing in.
Apps
Each app is the real thing, running in my Fabric tenant. The public copy is the same pages and charts on their opening view, with every number captured from the semantic model.
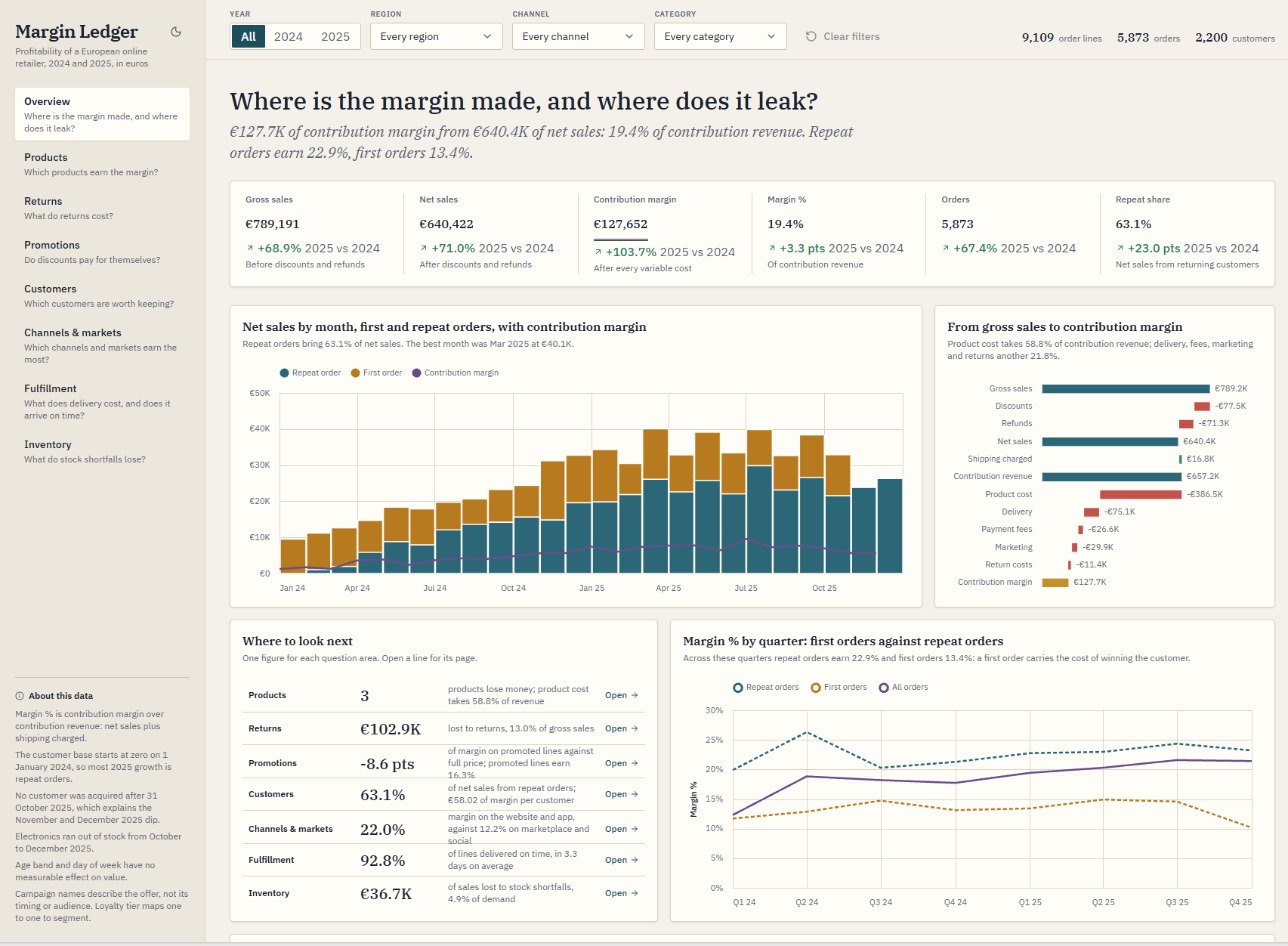
Margin Ledger
Eight pages over 9,109 order lines from a European online retailer, 2024 and 2025, in euros: Overview, Products, Returns, Promotions, Customers, Channels & markets, Fulfillment and Inventory. Each page opens on a business question, and every chart’s subtitle says what it found.
Claude built it from one prompt, along with the lakehouse and the Direct Lake semantic model under it: 83 DAX measures in 10 display folders. The post sets it beside the Claude dashboard built from the same brief.
8 pages, 36 Vega-Lite charts and 83 measures. The public copy shows the opening view; filters and cross-filtering work in the tenant app.
Data: the ZoomCharts Power BI Challenge for September 2026. The build and the comparison: Fabric Apps vs Claude Dashboards.
More on the way
One app here so far. More Fabric Apps land here as they’re built, each with a public copy you can click through.