Portfolio

Portfolio

A showcase of Power BI reports

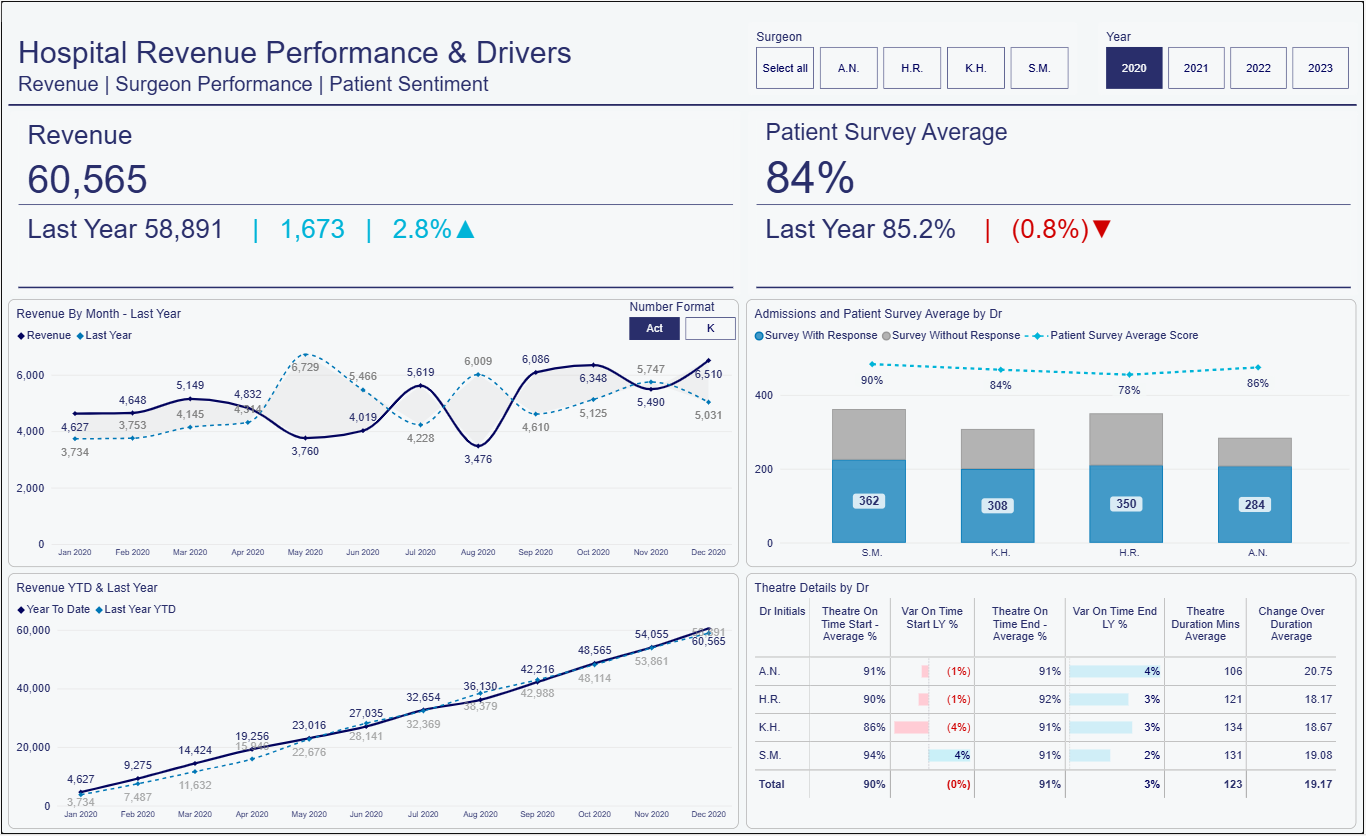
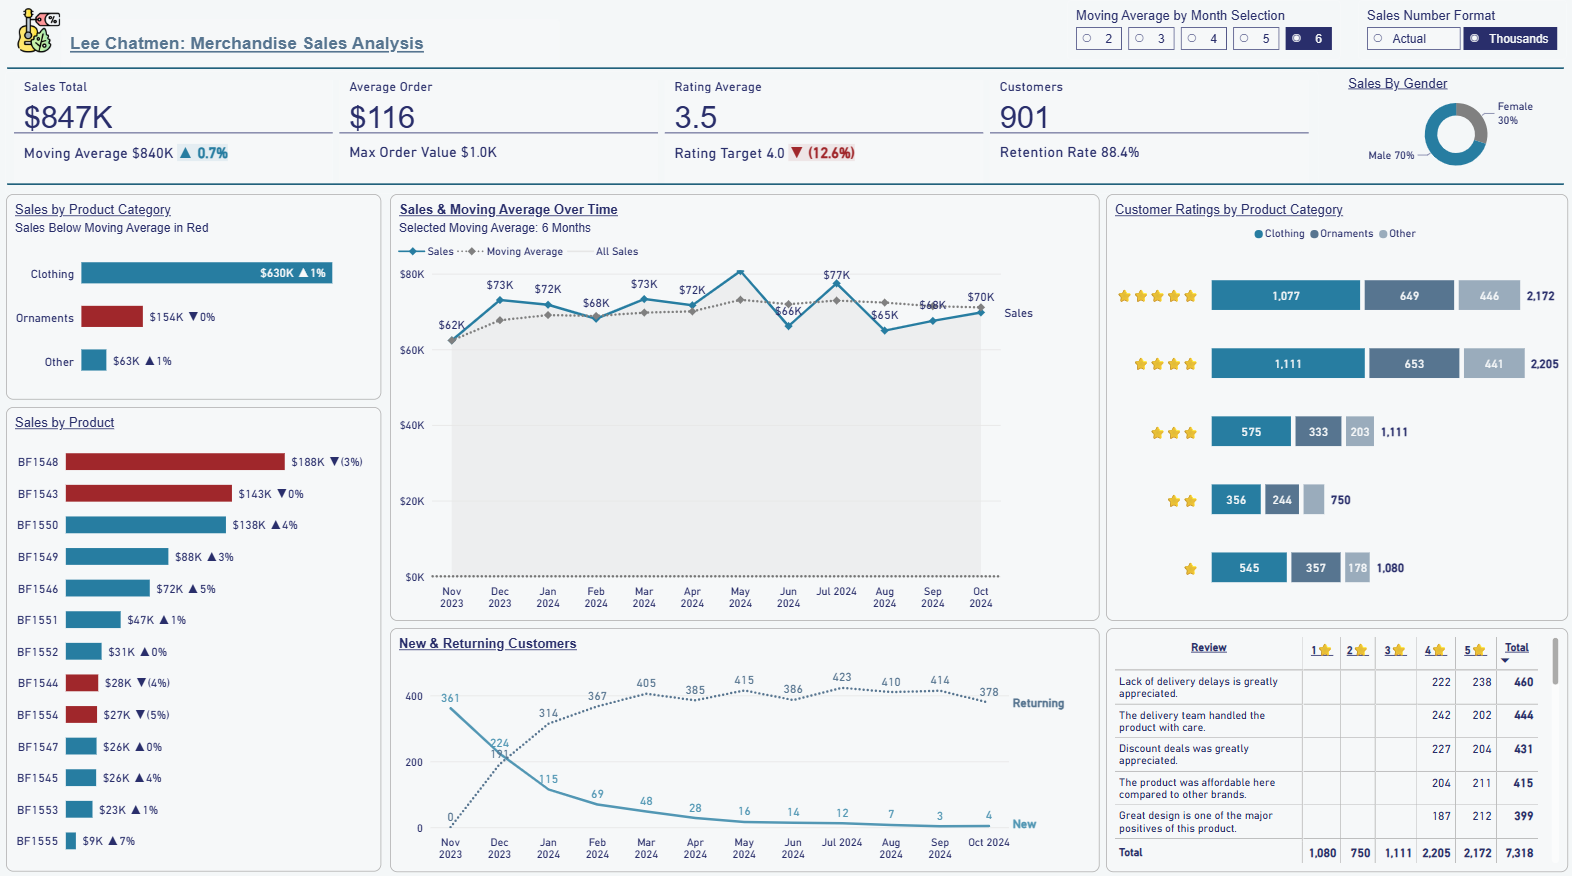
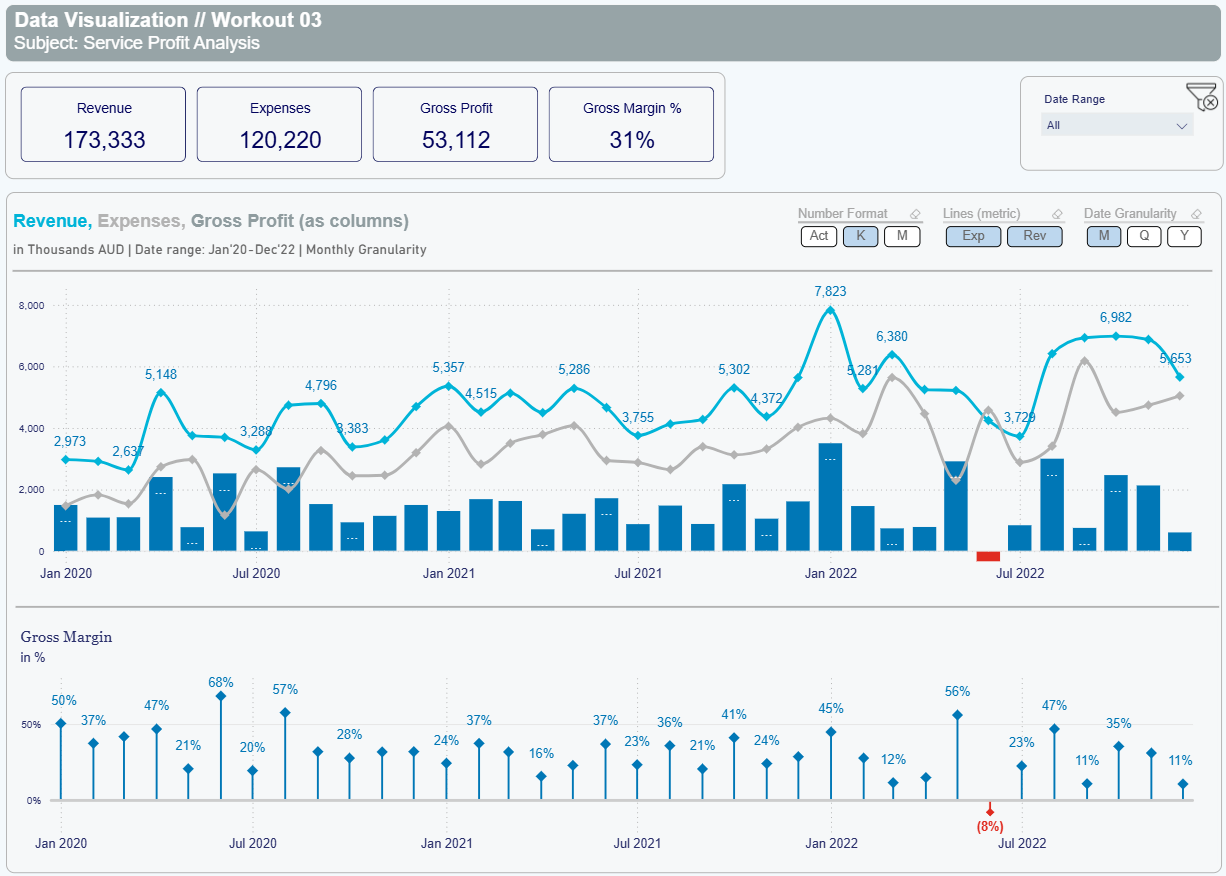
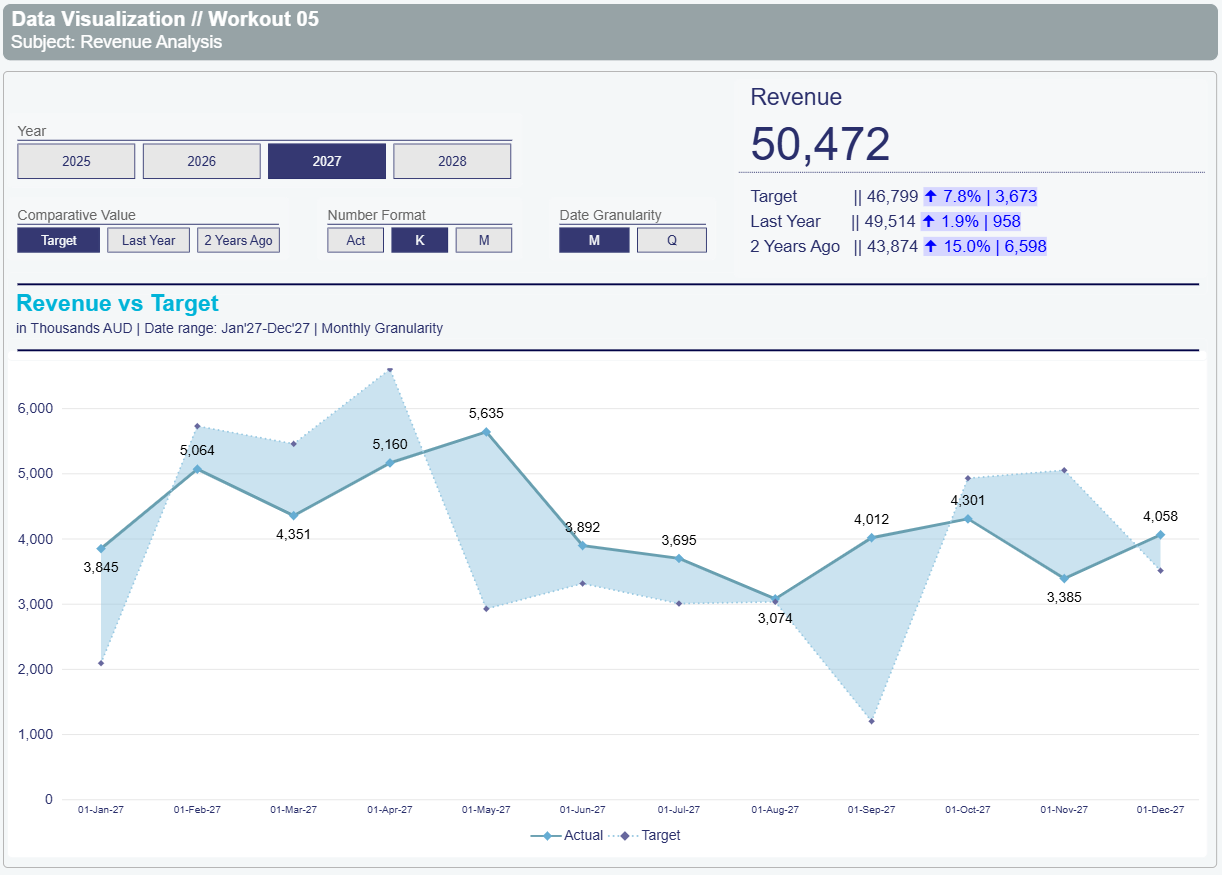
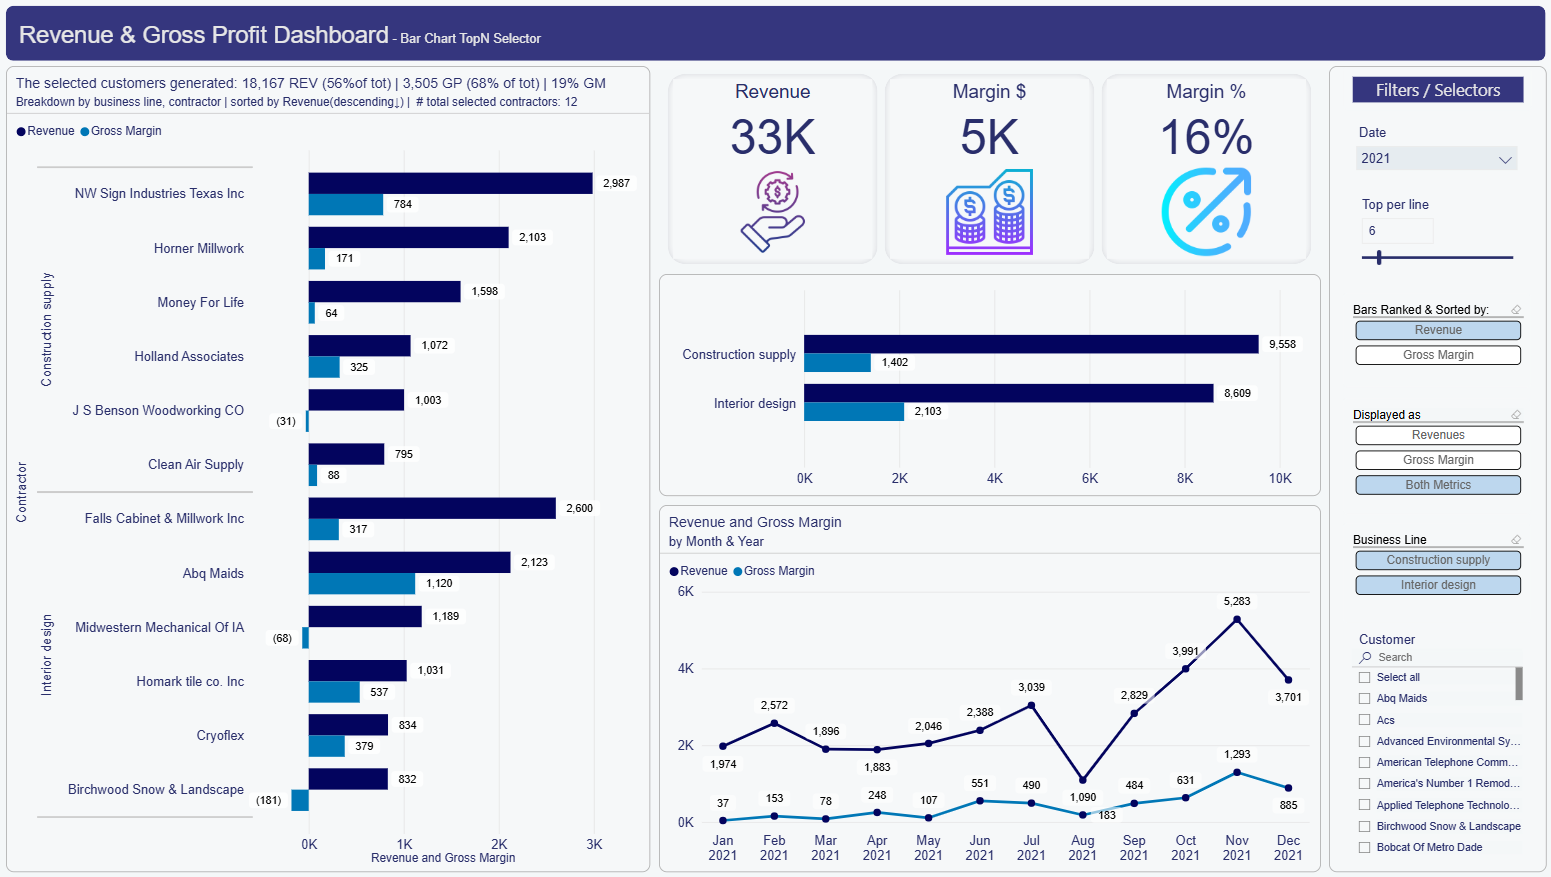
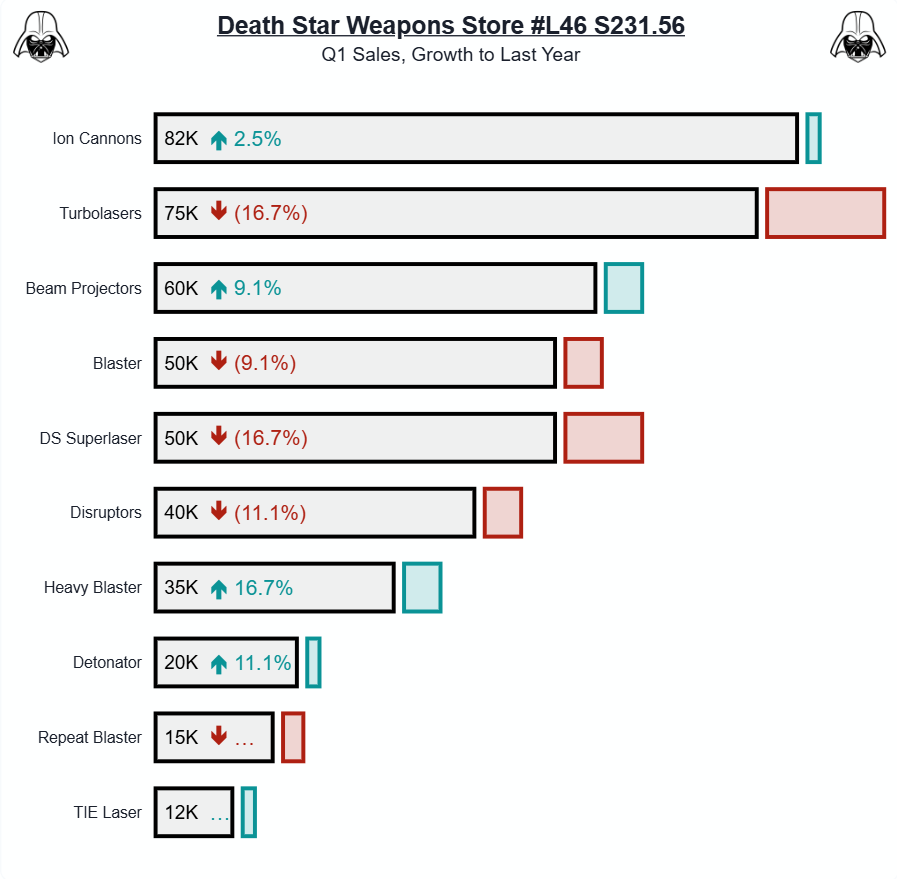
Six interactive reports exploring custom KPIs, field parameters, variance visualisation, and storytelling — built from real-world business problems.

6 reports Live Power BI embeds Interactive
01
Healthcare

Hospital Revenue Performance & Drivers

This report actually helped me to land my first PBI Dev contract with a private healthcare provider.

This is why it’s good to have a report showcase portfolio. Even better if your data is related to the industry in which you would like to work.

KPICustom TooltipsHealthcare
View Full Project
hospital-revenue.pbix
02
Sales

Onyx Data Challenge, Sales Analysis

This report gives insight into customer sales metrics like moving averages, new/returning customers, and satisfaction metrics.

The middle line chart uses a secondary y-axis that consistently shows all sales when dimensions are filtered, so the user can see what proportion of the whole the selected dimensions make up.

Moving AvgCohortsSecondary Axis
View Full Project
onyx-sales.pbix
03
Profit

Service Profit Analysis

This project explores the capabilities of field parameters.

Field parameters are a winning PBI feature for building highly interactive visuals. In this example users can dynamically control the displayed metrics, adjust date granularity, and see appropriate number formatting with the click of a button.

Field ParametersInteractivity
View Full Project
service-profit.pbix
04
Revenue

Revenue Analysis

This report focuses on showing variances to a selected metric (target, last year or 2 year’s ago).

The KPI in the top right shows an overview of the selected year and all of the comparatives while the line chart gives the detail on a monthly basis. This report also makes use of the very awesome PBI feature, field parameters.

VarianceKPIField Parameters
View Full Project
revenue-analysis.pbix
05
Dashboard

Revenue & Gross Profit Dashboard

This report makes use of a Top N selection as per business line (department).

This report also makes some great use of field parameters for selecting visible chart metrics. Report users are also able to sort the charts by revenue or gross margin via a slicer.

Top NField ParametersSlicers
View Full Project
revenue-gp.pbix
06
Variance

Variance Highlights with Stacked Bars

An exploration of what can be done with stacked bar charts in Power BI, this report showcases an alternative way of presenting a variance to last year.

The size of the variance is represented by the red or green stack to quickly show the reader where the gains and losses are coming from.

VarianceStacked Bars
View Full Project
variance-stacked.pbix