Power BI Card Trend Charts: a Chart Inside the Card
The November 2026 update gives the core Card visual a Trend axis. Put a field on it and the card draws its own chart, with no SVG measure. I built six cards to see what it can do, and the .pbix and data are free to download.
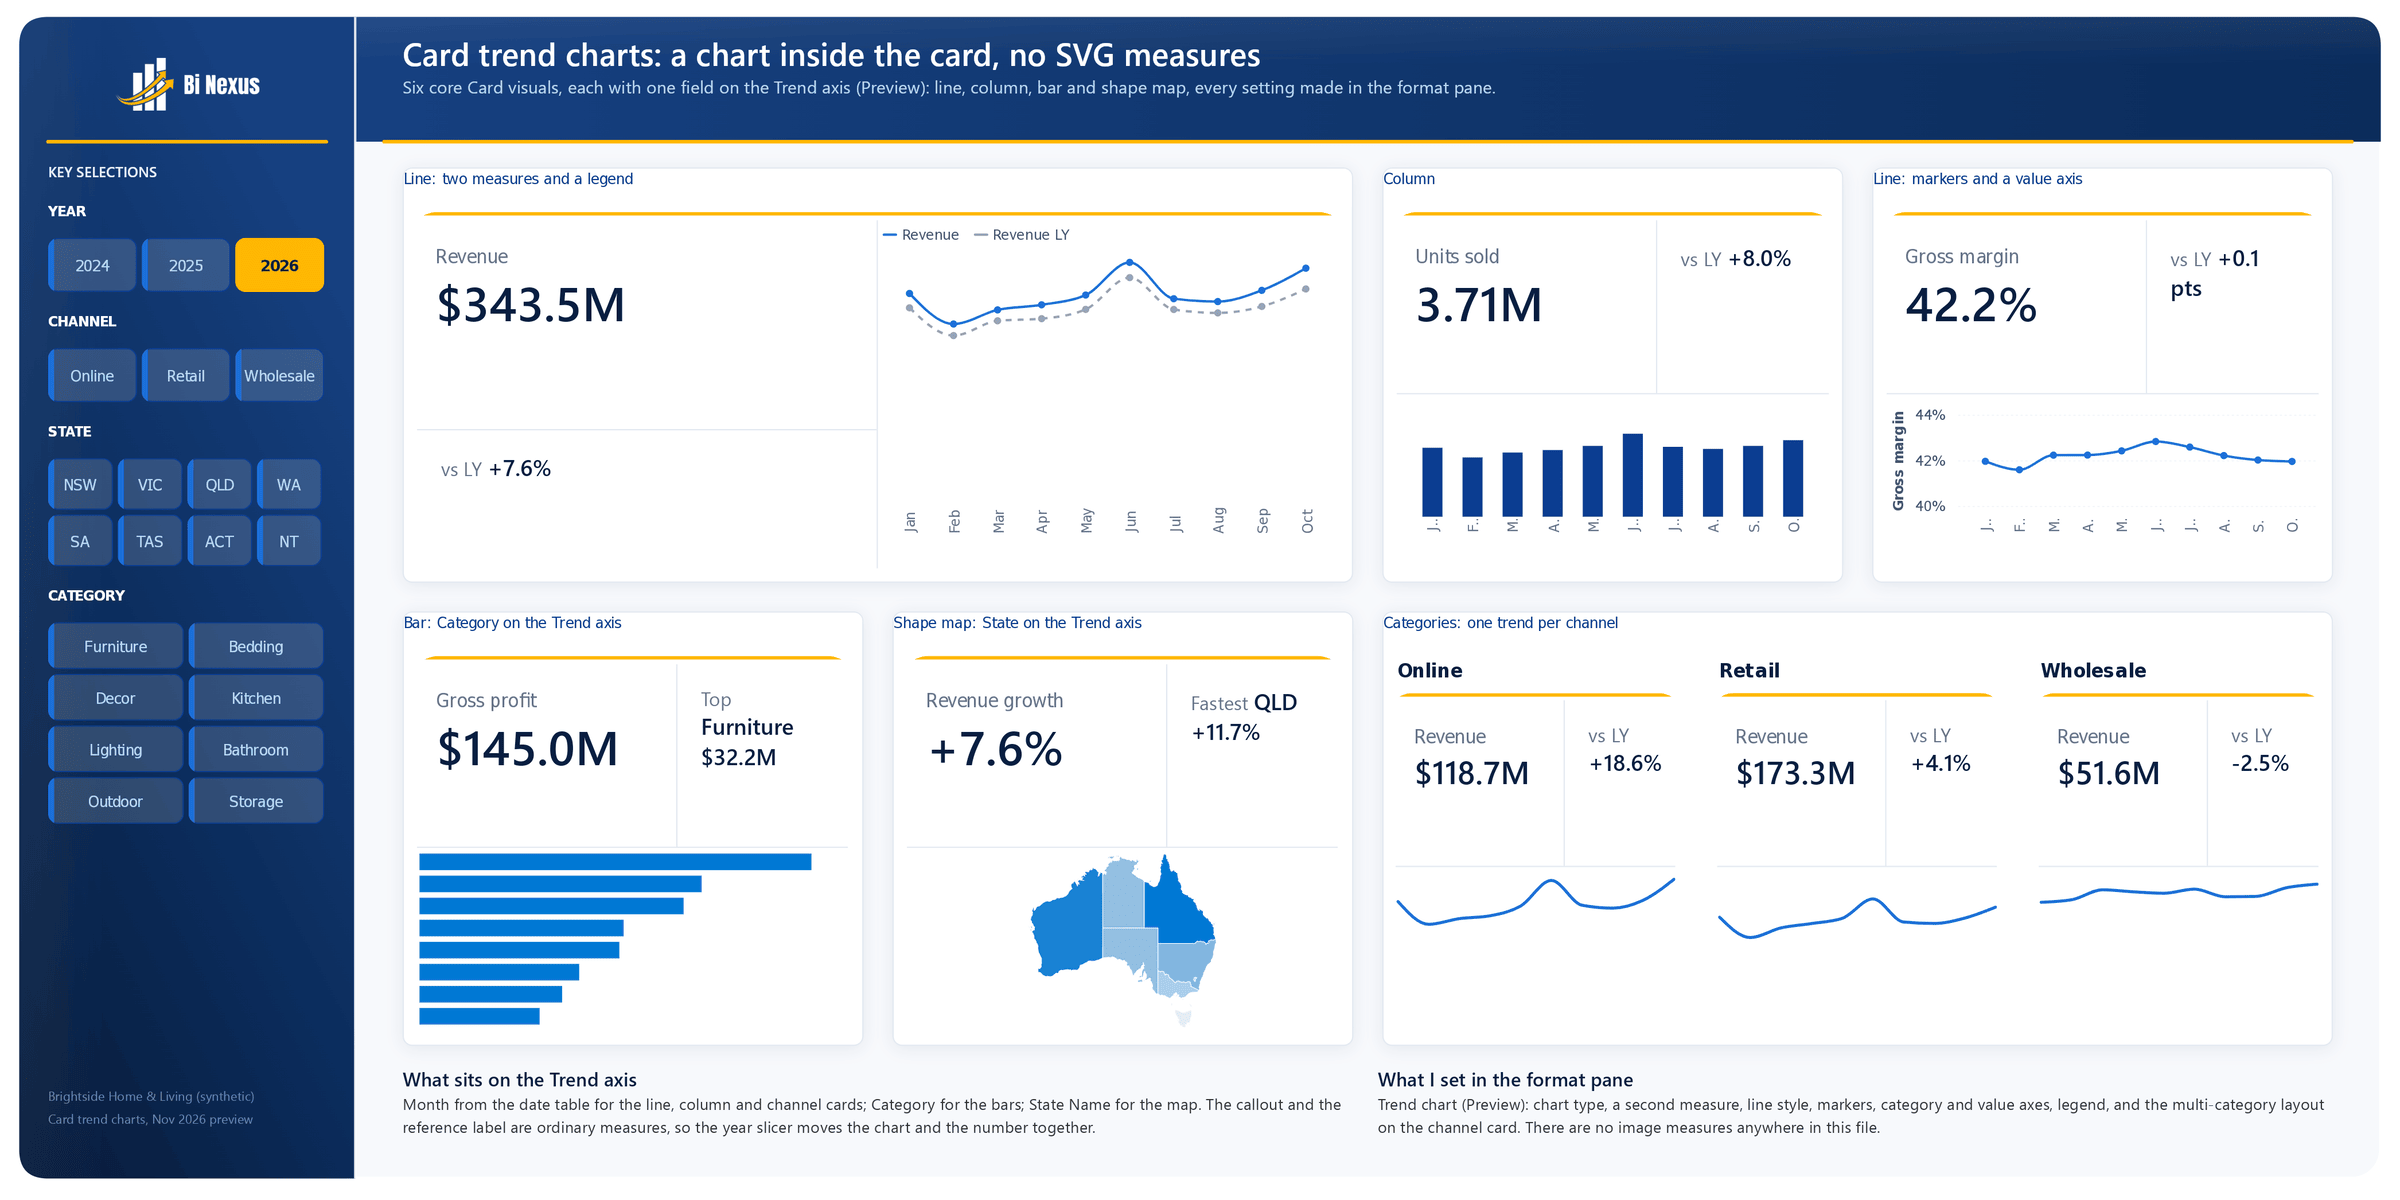
The Power BI November 2026 feature summary has a change I’ve wanted for a while: the core Card visual can now draw a trend chart. Add a field to the new Trend axis (Preview) well and the card plots its measure across that field, as a line, column, bar or shape map chart, right under the number.
Until now, a sparkline in a card meant writing an SVG measure and dropping it into the card’s image slot. It works, but it’s a lot of DAX for one small line, and the next person to open the report can’t format it without editing the measure. This one lives in the Format pane like every other setting.
So I built a page of six cards to see how far it goes. The .pbix and the small CSV behind it are free to download.
What the Trend axis does
Put a column on the Trend axis and the card plots its measure over that column’s values. A month column gives you a classic trend, a category column gives you a ranked bar chart, and a state column with a shape map gives you a small map. The chart and the callout read the same filters, so a slicer moves the number and the chart together.
The Format pane gets a new Trend chart card. Pick the chart type there, then set:
- more measures on the same chart (Value, with Include primary measure to keep or drop the card’s own measure)
- a legend, a category axis and a value axis, each with its own font and colour
- Lines: style, width, smooth or straight, shaded area, markers and data labels, for all series or one at a time
- Bars: colour and data labels
- tooltips and padding
Where the chart sits is up to the card’s own layout, under Cards. Order puts the chart before or after the callout and the reference labels, and Callout size sets how much room the number gets. With Collage on, the first two parts in the order share a column or a row and the third gets the rest: a column of its own when Arrangement is Vertical, a row along the bottom when it’s Horizontal.
The six cards
Every card uses the same order (Order: Callout, reference label, trend chart) with Collage on. Five of them are Horizontal, so the number and the reference label sit side by side and the chart runs along the bottom. What changes from card to card is the field on the Trend axis and the Trend chart settings.
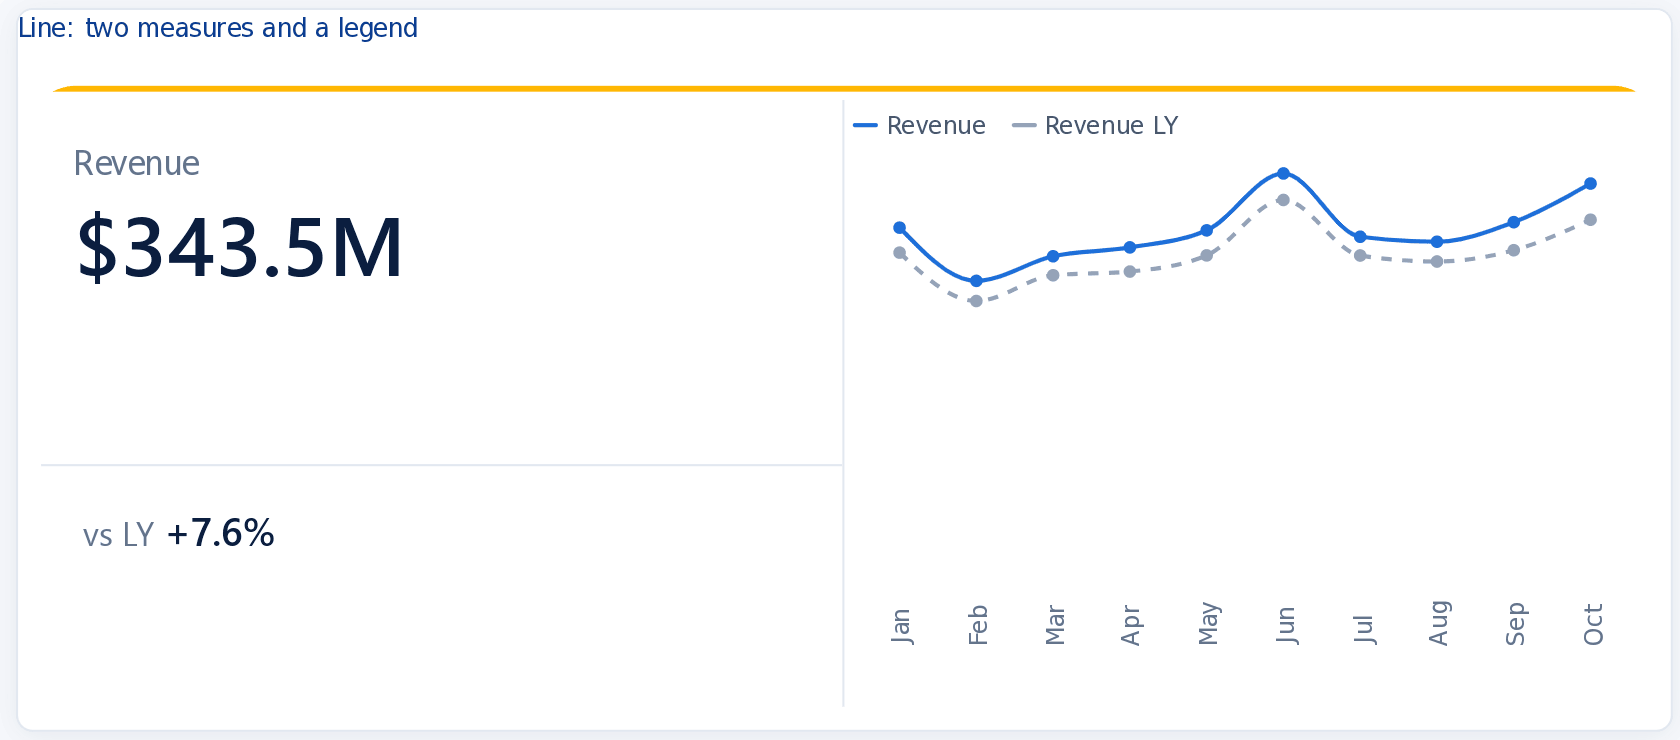
- Line, two measures and a legend. Revenue by month, with Revenue LY added under Trend chart > Value. In Lines, Apply settings to Revenue LY, I set the line style to Dashed and the colour to grey, so this year reads first. This is the one Vertical card, so the number and the reference label stack on the left and the chart takes the right.
- Column. Units sold by month as navy columns. With Cards > Arrangement set to Horizontal, the reference label (vs LY) sits beside the number rather than under it.
- Line with markers and a value axis. Gross margin by month, with markers on and the value axis starting at 40%, so a move of half a point is visible.
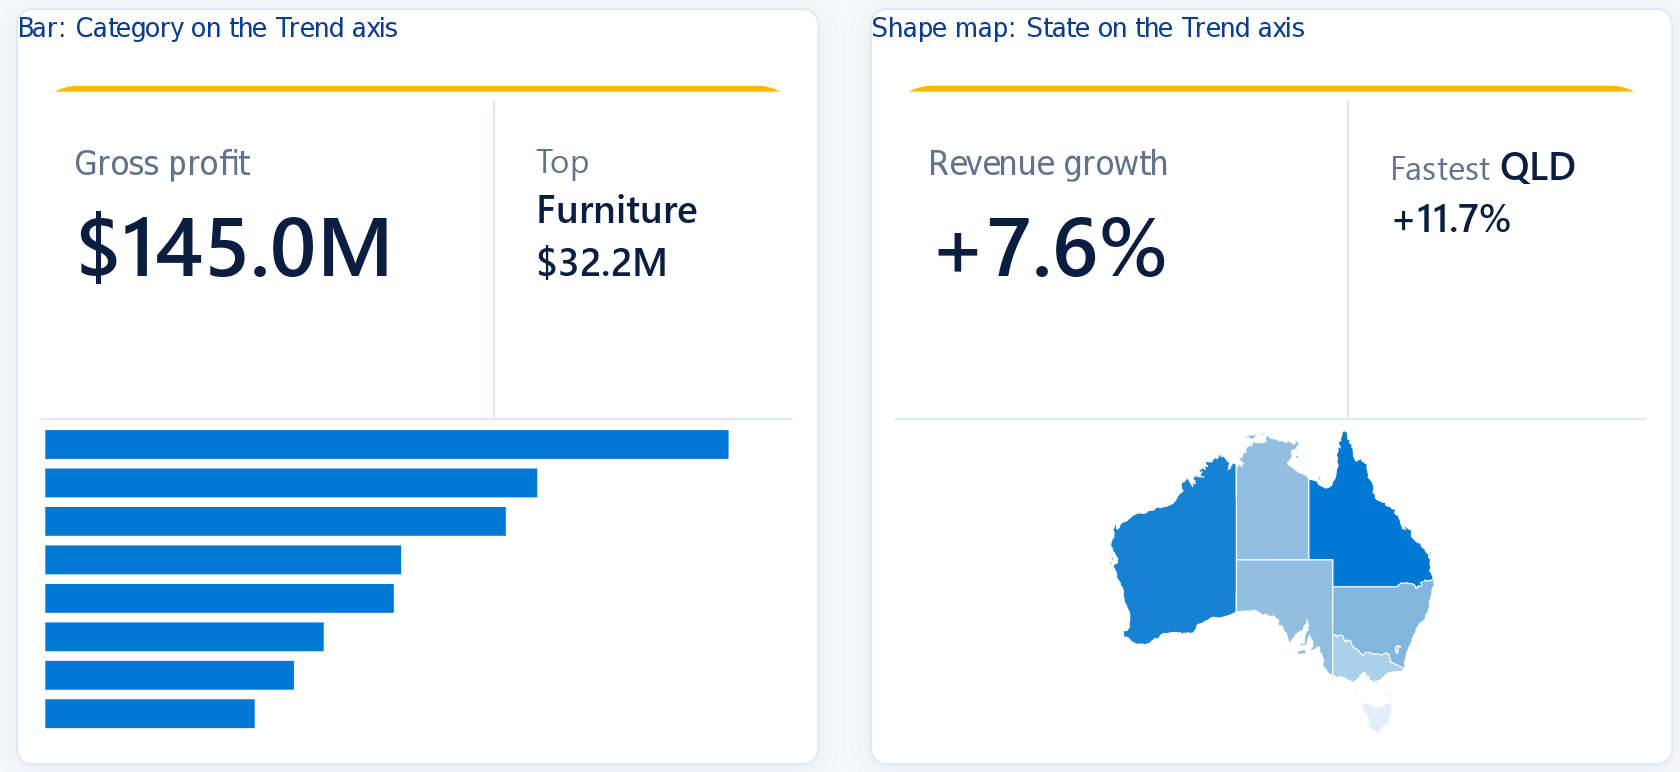
- Bar. Gross profit with Category on the Trend axis. The bars follow the column’s sort order, so a hidden Category Order column (set with Sort by column) ranks them by 2026 gross profit. The reference label names the top category with a small text measure.
- Shape map. Revenue growth with State Name on the Trend axis and the Australian states map picked in the Trend chart card. The darker the state, the faster it grew, and a second text measure names the fastest one.
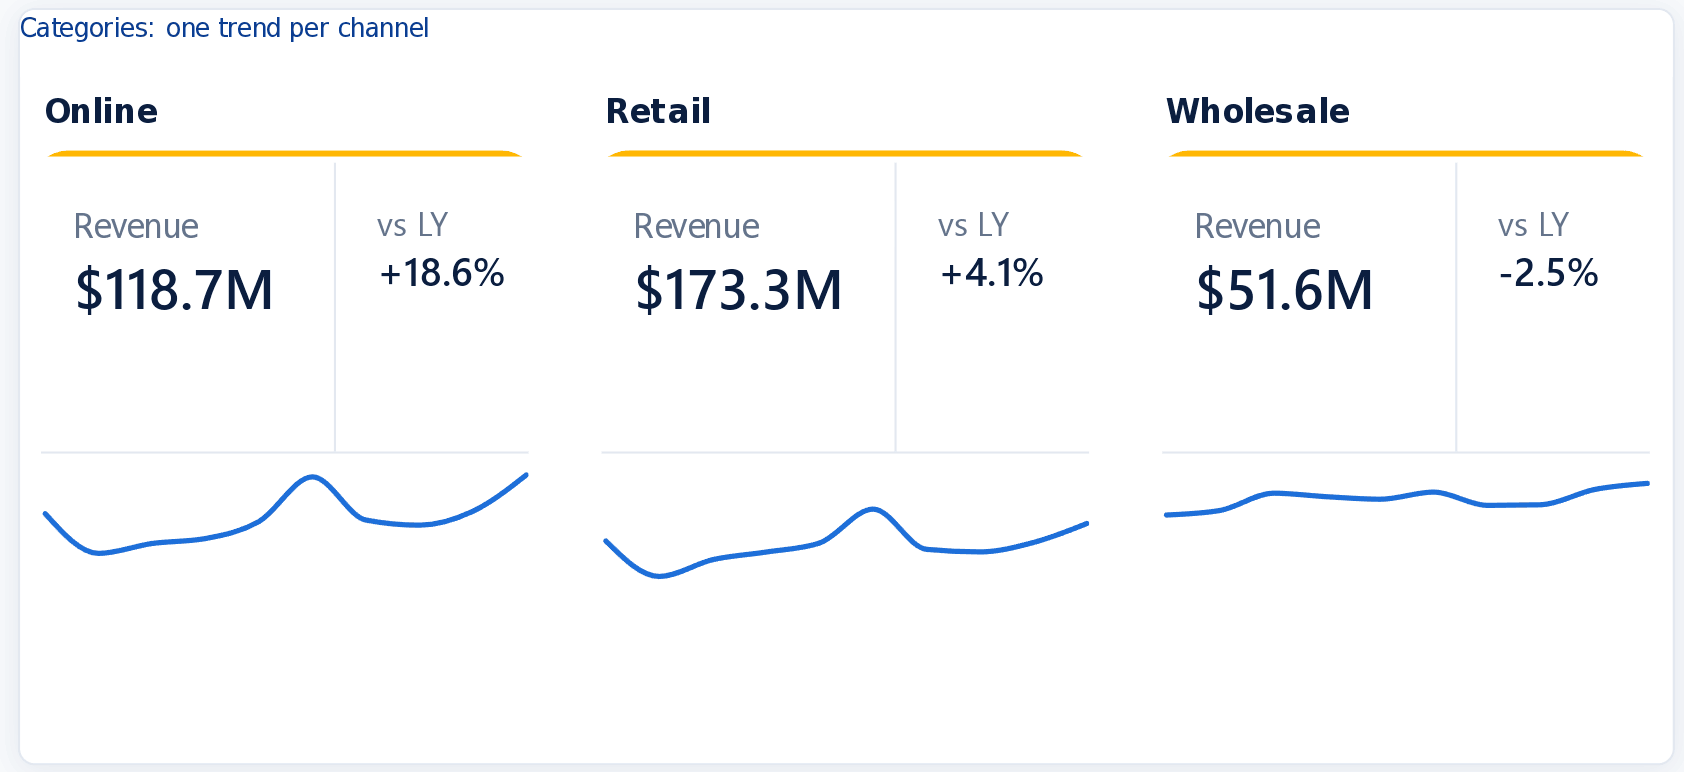
- One trend per channel. Channel goes on the card’s Categories well, so the card repeats once per channel and each copy gets its own trend. In Multi-category layout I set the arrangement to Horizontal, under Category header I set the title orientation to Horizontal, and I turned the category axis off, since all three charts share the same months.
How I put the page together
The data is a made up homewares retailer, Brightside Home & Living: monthly sales from January 2024 to October 2026 across eight states, three channels and eight product categories. That’s 6,528 rows and seven columns (Month, State, Channel, Category, Revenue, COGS and Units) in one 348 KB CSV.
The model is a small star: the Sales table, a date table, and one table each for State, Channel and Category. Revenue LY is the usual CALCULATE with DATEADD over the date table, and the money measures share one dynamic format string, so 343 million in revenue shows as $343.5M.
The page uses the same side panel and header as my P&L bridge demo, in the BI Nexus colours, with Year, Channel, State and Category slicers down the side. Every card listens to all four, so picking Retail or 2025 redraws the charts as well as the numbers. I built it as a PBIP with Claude Code and my PBI_Agentic_Dev plugins, then checked each card in Desktop.
What I noticed in the preview
I built this on the October Desktop build, where the trend chart code was already present but switched off, and turned it on to get a head start on the November release. Some of what follows may just be that early code, so check it in your own build.
- The bar chart drew bars only. No category labels and no data labels, even with both turned on, which is why the reference label on that card names the top category.
- Narrow cards shorten the month names. On the 384 pixel cards the category axis cut Jan, Feb and Mar down to a letter or two. Widen the card or turn the axis off. Raising Minimum category width gives the labels room, but adds a scroll bar once the months stop fitting.
- A value axis costs width. On a narrow card it takes room from the plot, so only use it where the scale matters, like the margin card.
Download the .pbix and the data
The report is free to download, with the data baked in so it opens without the CSV. You need Power BI Desktop with the November 2026 update. If the Trend axis well isn’t in the Build pane, look under File > Options and settings > Options > Preview features. In an older build the cards still open, just without their charts.
Card Trend Charts.pbix github.com/InsightfulAnalytics/PBI-Files
brightside_card_trends.csv 6,528 rows, 348 KB
To refresh from the CSV, save it to a folder, then in Desktop choose Transform data > Edit parameters and point DataFolder at that folder. The data is synthetic, so the repo’s MIT licence covers it too. Both files sit with the rest of my free Power BI files.
Changelog
- 19 Nov 2026: published.
Feedback, or a correction?
If something here could be clearer, more accurate or done a better way, I’d like to hear it.